
Supporting Scientists in Fighting Diseases
Biogents (www.biogents.de) is a developer and manufacturer of highly efficient innovative mosquito traps used by B2B and B2C customers worldwide.
The "BG Counter 2" product is an automated, internet-connected mosquito counting device used for professional mosquito monitoring.
For several years, users have had access to a web portal ("1.0") for this monitoring, which is now being redesigned and expanded as part of a redesign project with an external software agency.
Using the Human-Centered Design approach, an interactive wireframe was developed to efficiently define product requirements and enable direct handover to software development.
This resulted in a new IoT (Internet-of-Things)-enabled web portal that not only fulfilled user needs but also elevated the product value of the BG Counter to a leading benchmark level within the industry.
Background
After logging into web portal 1.0, the user initially sees the dashboard view. As shown in Figure 1, the dashboard provides an overview of all counters on a map, as well as a table with the current catch data.
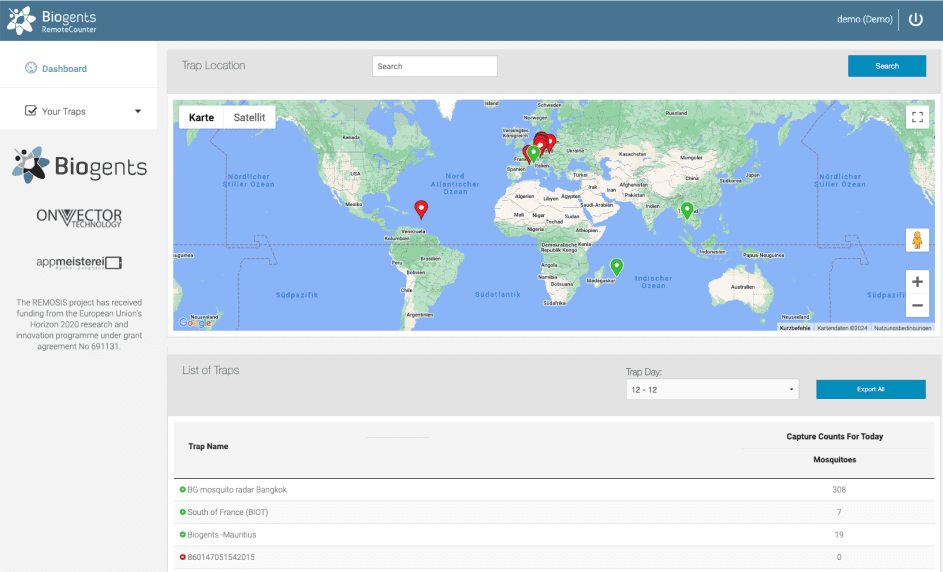
Figure 1. Web portal 1.0: Dashboard with map and list overview of all counters.
By selecting a counter, the user is directed to the detail view of a device (see Figure 2).
This view includes a detailed map with information on the exact positioning of the counter, a schedule for counter configuration, and a chart showing the catch progress of the current day. The display can be customized by the user to view historical data as well.
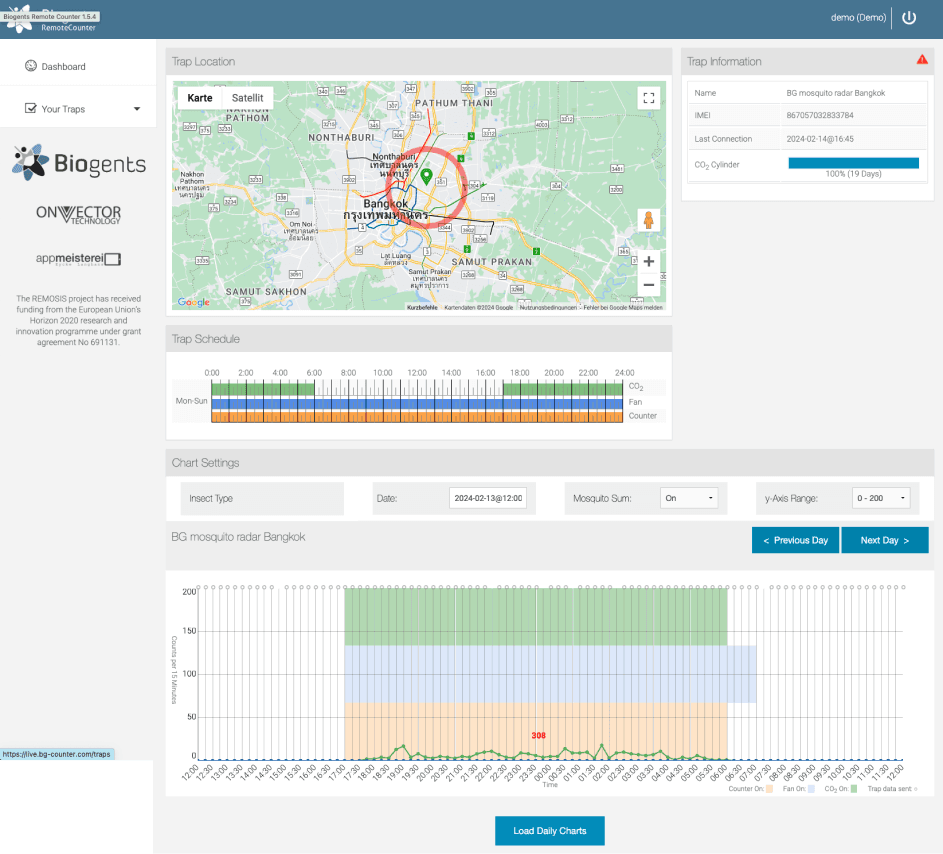
Figure 2. Web portal 1.0: Detail view of a counter.
Project Goals
UX evaluation of the current implementation (Portal Version 1.0)
Highlighting UX improvement potentials and designing specific enhancements
Developing a new user concept
Deriving and handing over requirements for software development
Method & Participants
Discovery: Interviews with n=8 power users regarding Portal Version 1.0:
Identification of highlights & lowlights
Collection of feature ideas
Ideation & Design:
Two email surveys to a total of n=7 power users to clarify specific feature requirements
Internal interviews with n=2 employees from the sales team on special topics (Distributor View)
Wireframe usability tests with a total of n=5 power users
Insights
The discovery interviews revealed some already known but also various new potentials and improvement possibilities for the BG Web portal 1.0. Figures 4 - 6, for example, show the summarized insights into the counter overview table in the dashboard.
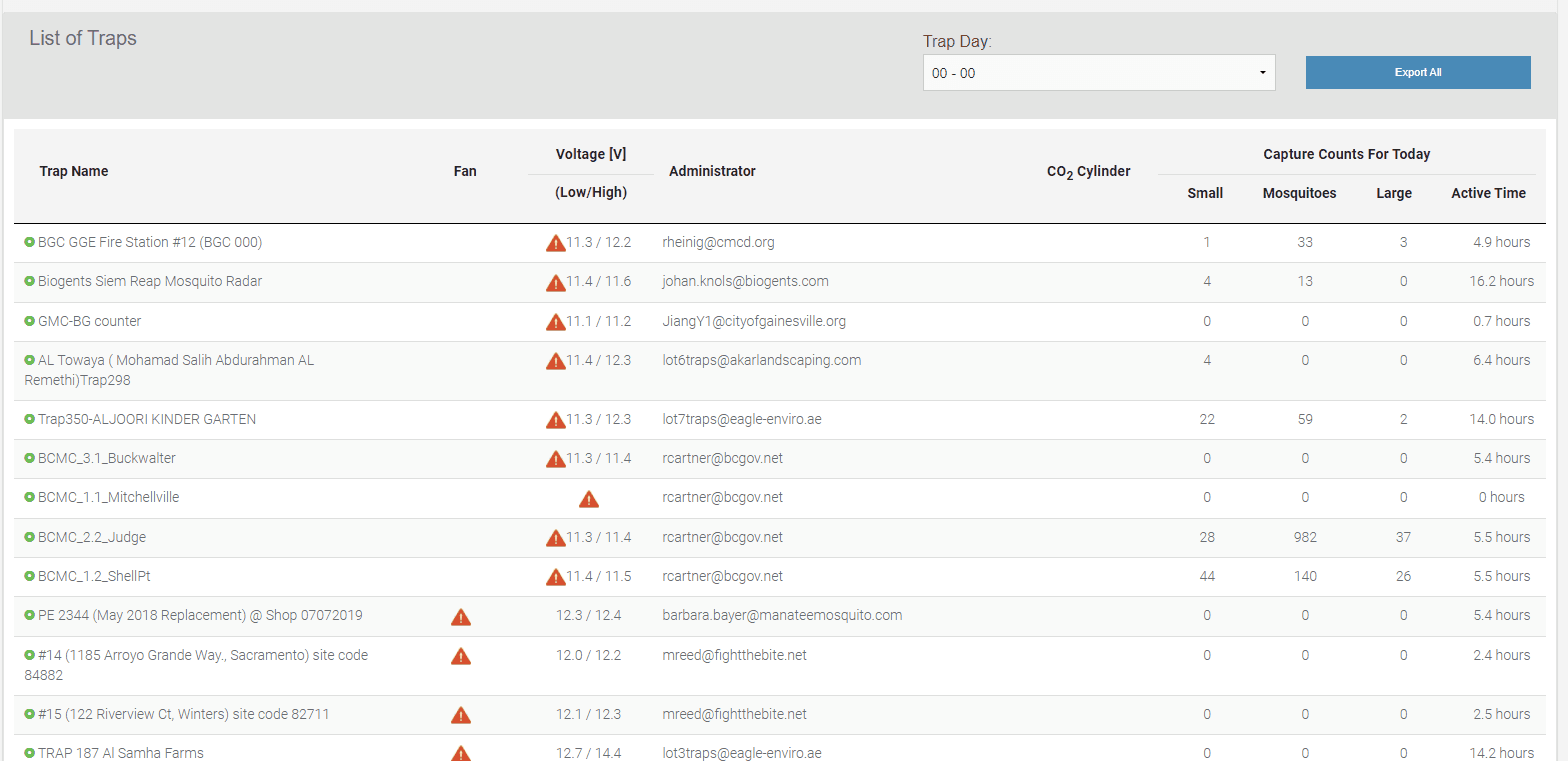
Figure 3. Web portal 1.0: Counter table in the dashboard.
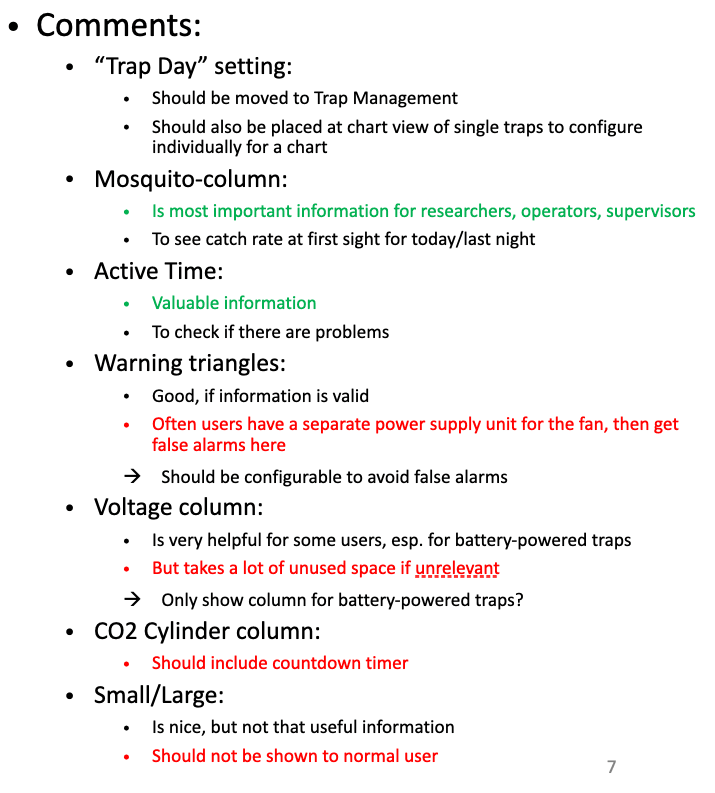
Figure 4. Web portal 1.0: Summarized feedback on the counter table.
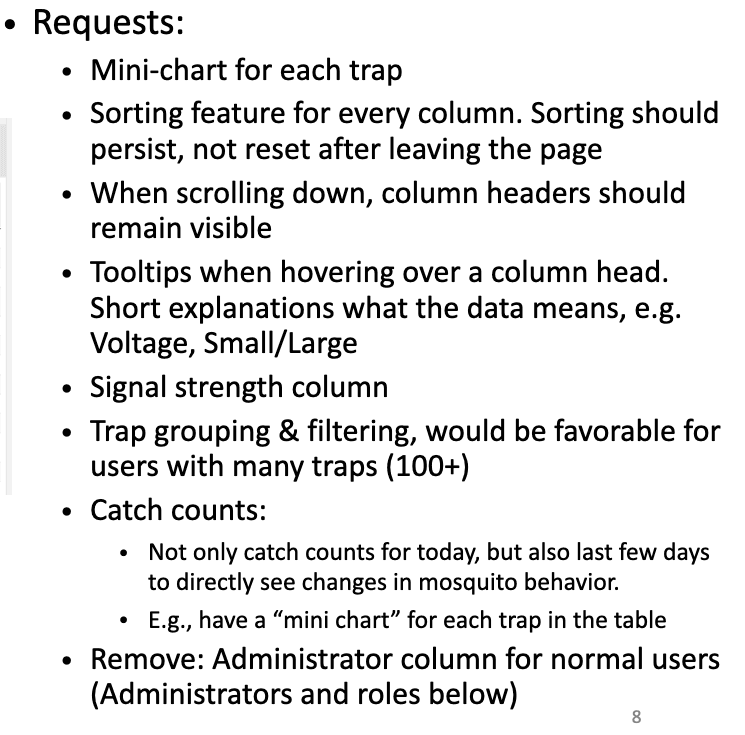
Figure 5. Web portal 1.0: Collected user requirements for the counter table.
The email surveys allowed the efficient resolution of specific issues, particularly providing a workable asynchronous solution for gathering feedback, especially from foreign users in different time zones.
The wireframe usability tests significantly accompanied the concept development. This enabled the best possible redesign of the web portal through continuous user feedback.
A total of 4 user flows were designed in Adobe XD and tested through specific user stories, which were given to all participants in 1:1 sessions and worked on using the thinking-aloud method. Figure 9 provides an overview of the complete wireframe.
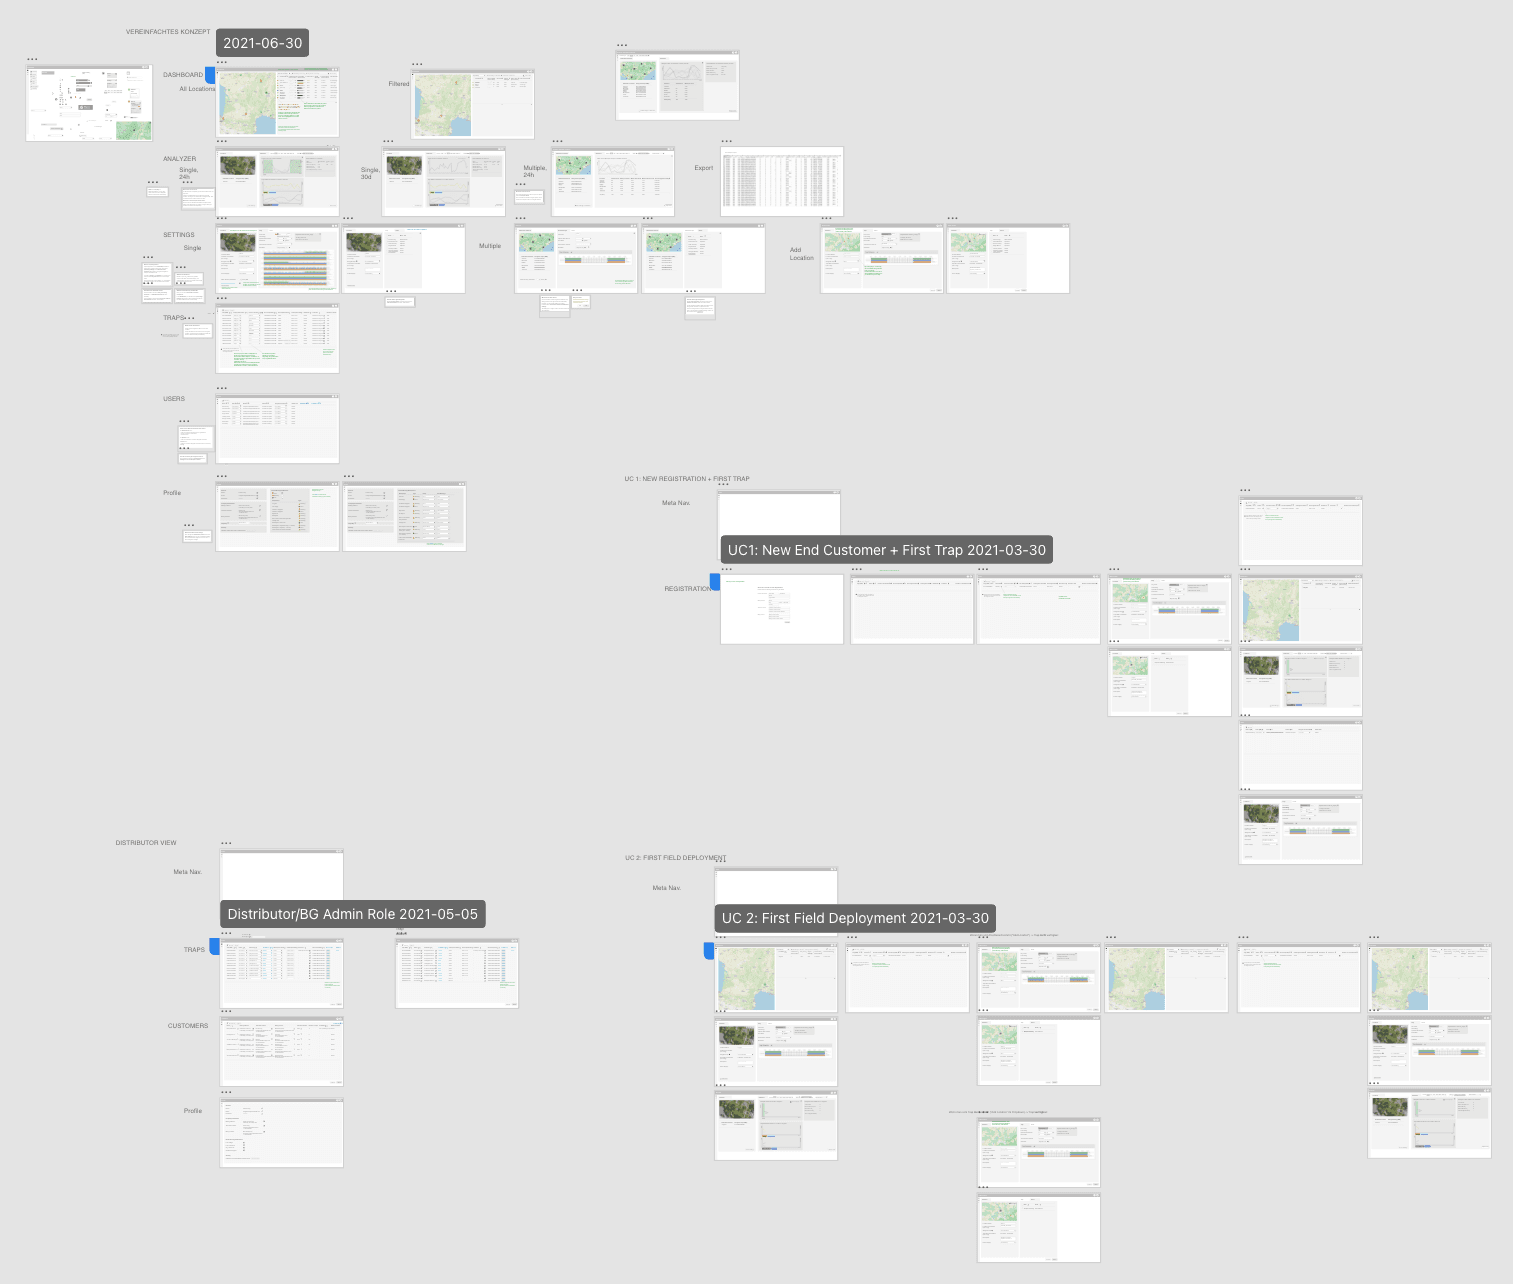
Figure 9. Web portal 2.0: Overview of the complete wireframe.
Figure 10 illustrates the complex interaction possibilities within a depicted user flow.
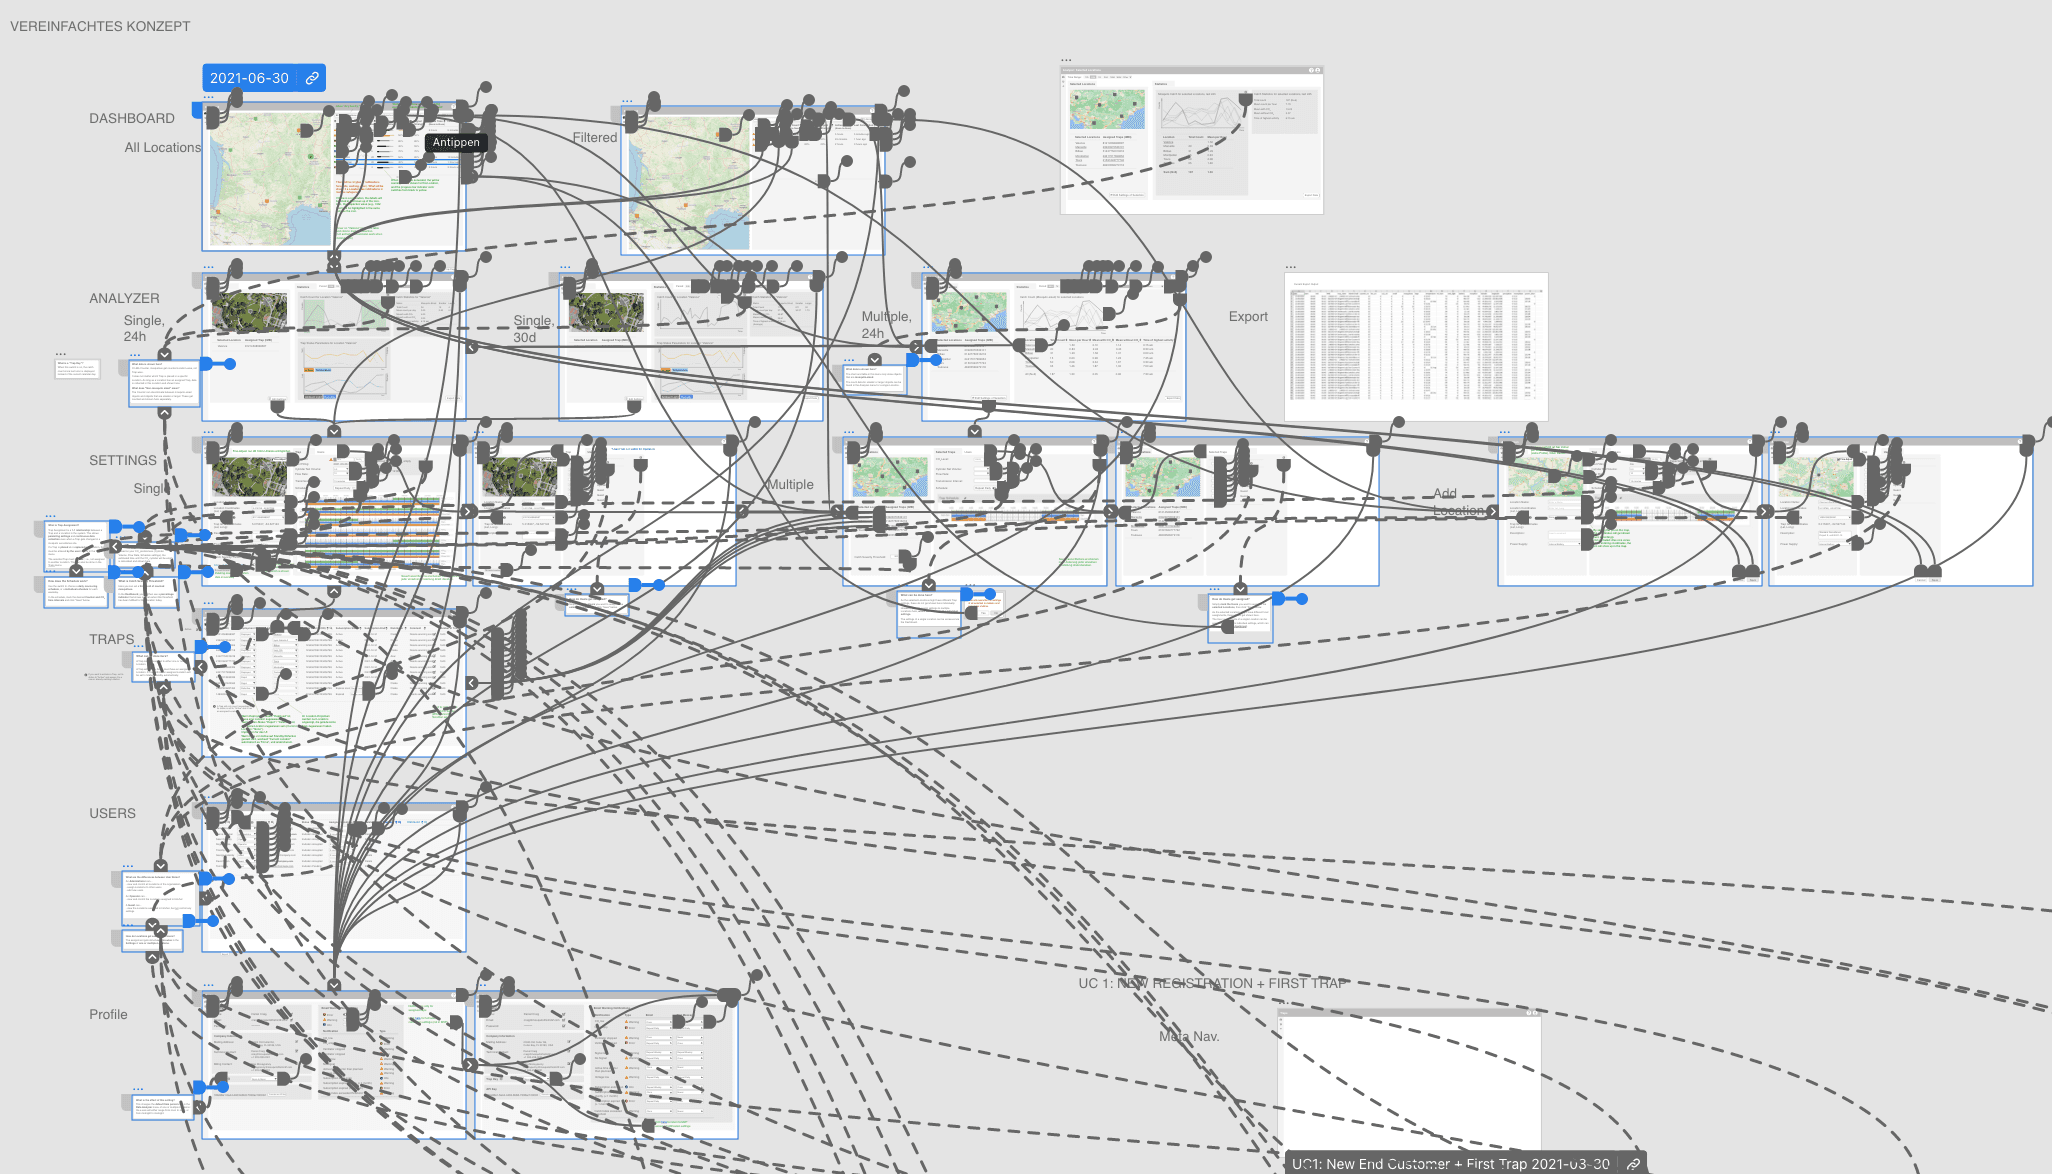
Figure 10. Web portal 2.0: Representation of the complexity within a depicted user flow.
Results
The described methods allowed the user-centered development of an interactive wireframe, which was always available for testing and exploration by all project participants, thus providing a concrete and efficient basis for ongoing project progress. This applied to internal reconciliation within Biogents as well as communication with the external software development partner.
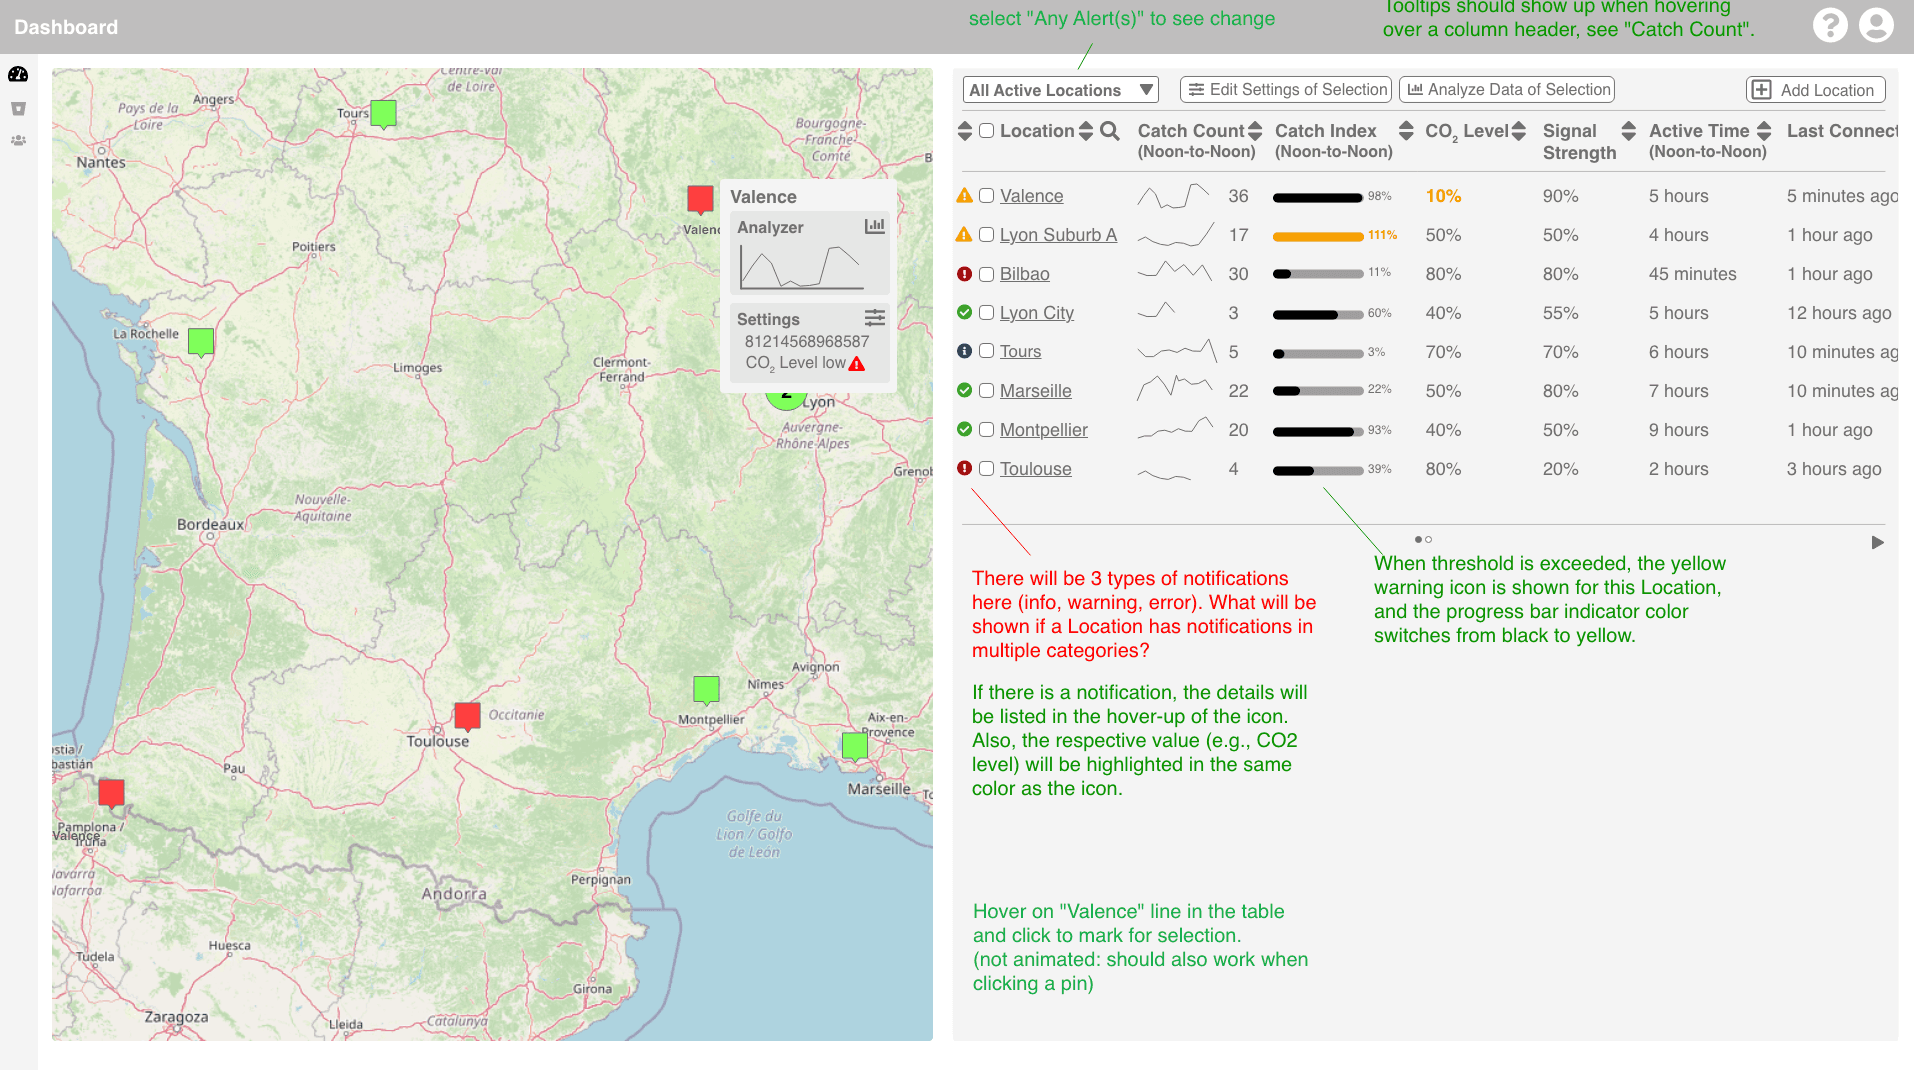
Figure 11. Web portal 2.0: Dashboard wireframe screen (with markups).
Finally, specific requirements for software development were specified from the wireframes. The implementation result can be viewed on the official Biogents website.
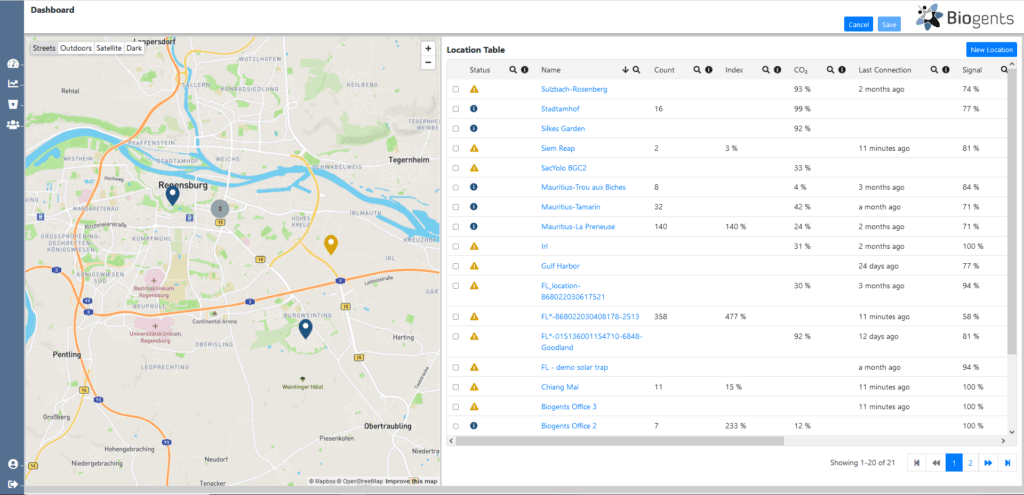
Figure 14. Web portal 2.0: Final dashboard.
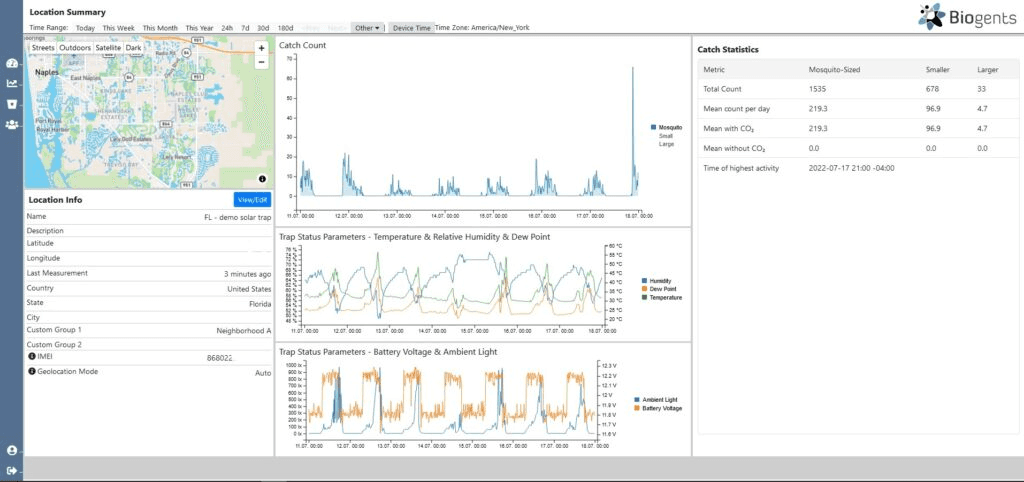
Figure 14. Web portal 2.0: Final counter detail view.
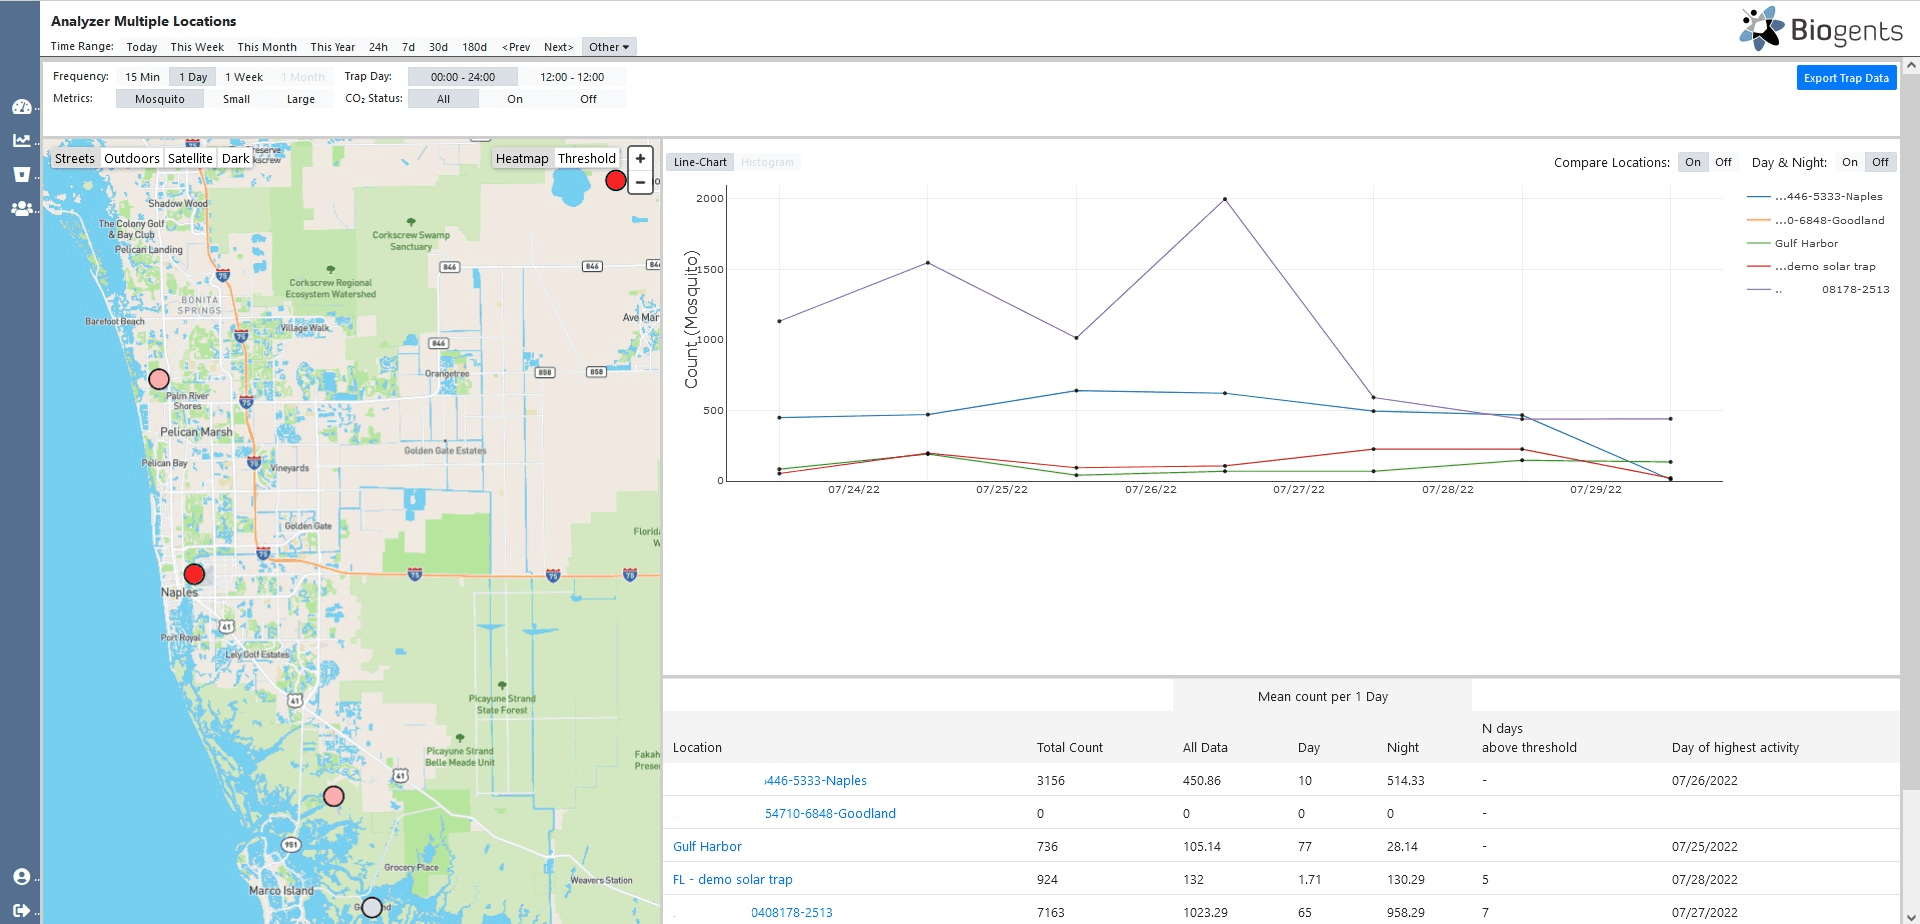
Figure 15. Web portal 2.0: Final analyzer menu.
Furthermore, a detailed customer tutorial video is available on YouTube, highlighting the newly introduced "Locations" concept through the project.